Aerbits Architecture
Aerbits (Background)
Aerbits is a software service designed to leverage drones and AI to help cities manage waste. In 2021, the waste management issues in my little neighborhood in San Francisco were so bad that I decided to do something about it. It all started with a realization that when I reported dumping to the city, they would come out and clean it up. So why was the neighborhood so dirty? The answer was that it wasn't always consistently being reported. The city's published data on 311 reports showed that many of the piles of waste were not being reported. So I decided to build a way to report every pile of waste in the neighborhood.
Aerbits Functional Responsibilities
Aerbits is a platform that consists of a few different functions:
- Data collection
- Data processing
- Data storage
- Data visualization
- Data reporting
Aerbits Overall Architecture (AWS/AWS Amplify)
Aerbits is hosted completely within Amazon Web Services (AWS). The platform is designed to be serverless, and to use event based triggers to: start processing data, start the model for machine vision, and parallelize the processing for faster results. This approach also allows for robust monitoring and reproducibility because every operation is represented by an event, which can be re-queued and logged. That means any stage that fails, can be rerun from the output of the previous stage.
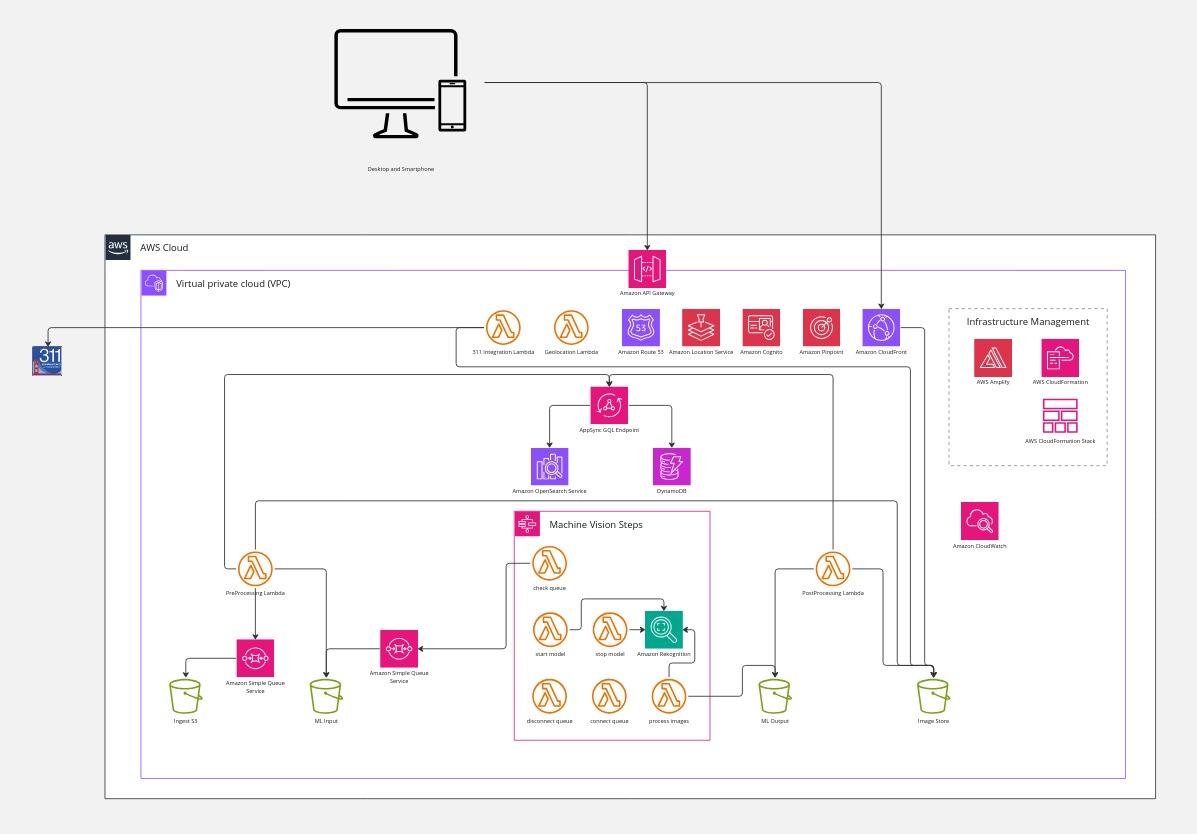
Infrastructure is managed by AWS Amplify and AWS Cloudformation. The infrastructure is defined in a set of JSON files, which can be converted to Cloudformation templates, and deployed to AWS. We use Amplify, which provides a set of tools for managing the infrastructure, and a set of React components for integrating nearly any AWS service into a web application.
Data Ingestion
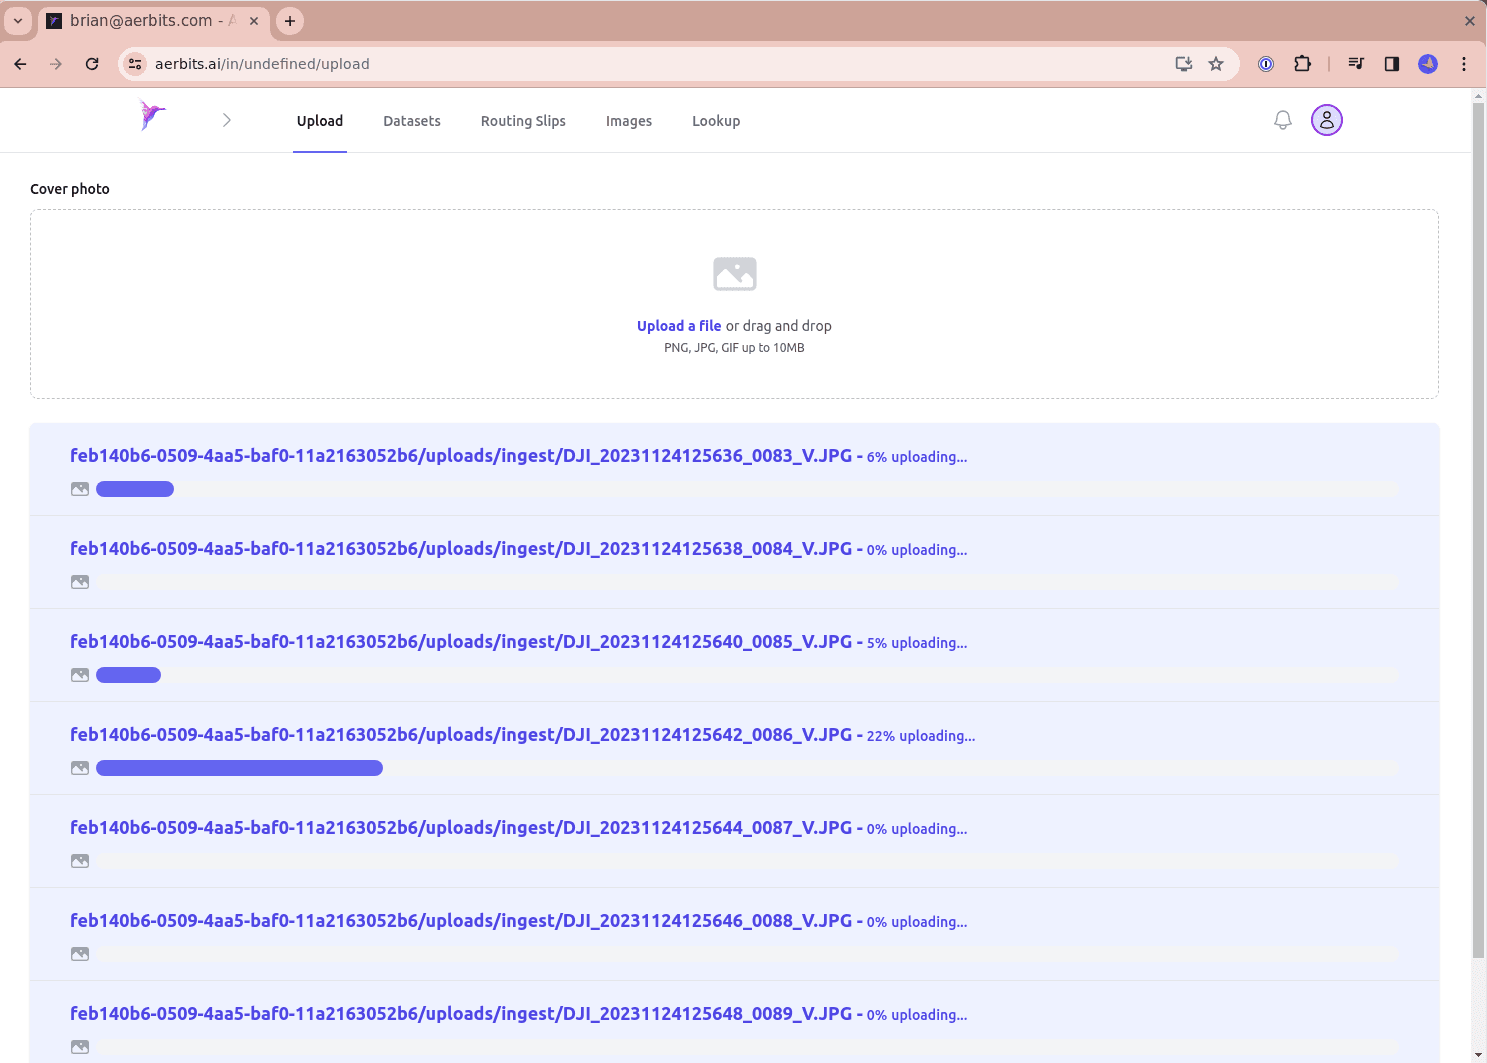
The data ingestion pipeline is a serverless function that is triggered when the drone returns from a flight. The images are either uploaded wirelessly from the drone, or manually from an SD card. Aerbits offers several upload tools:
- Web interface for uploading
- Accepts dropped files
- Uploads images to the cloud
- Data processing pipeline starts once per hour, if there are new images
- CLI tool for uploading
- Recognizes plugged-in drone
- Copies images and flight logs to local machine
- Uploads images and flight logs to the cloud
- Starts data processing pipeline immediately
The CLI tool also offers the capability to offload the images from the SD card, upload them to the cloud, and to immediately start the machine vision processing pipeline.
Data Ingestion and Processing Overview
The data processing pipeline is a combination of image resizing, naming, storage, cataloging, and indexing, plus a machine vision model that detects waste in the images.
There are three parts to the data processing pipeline:
- Preprocessing
- Machine Vision
- Postprocessing
Preprocessing
Preprocessing is necessary to prepare the images for machine vision processing, display, and to ensure the files are stored in a way that is easy to access and search, and does not result in overwriting files or losing data.
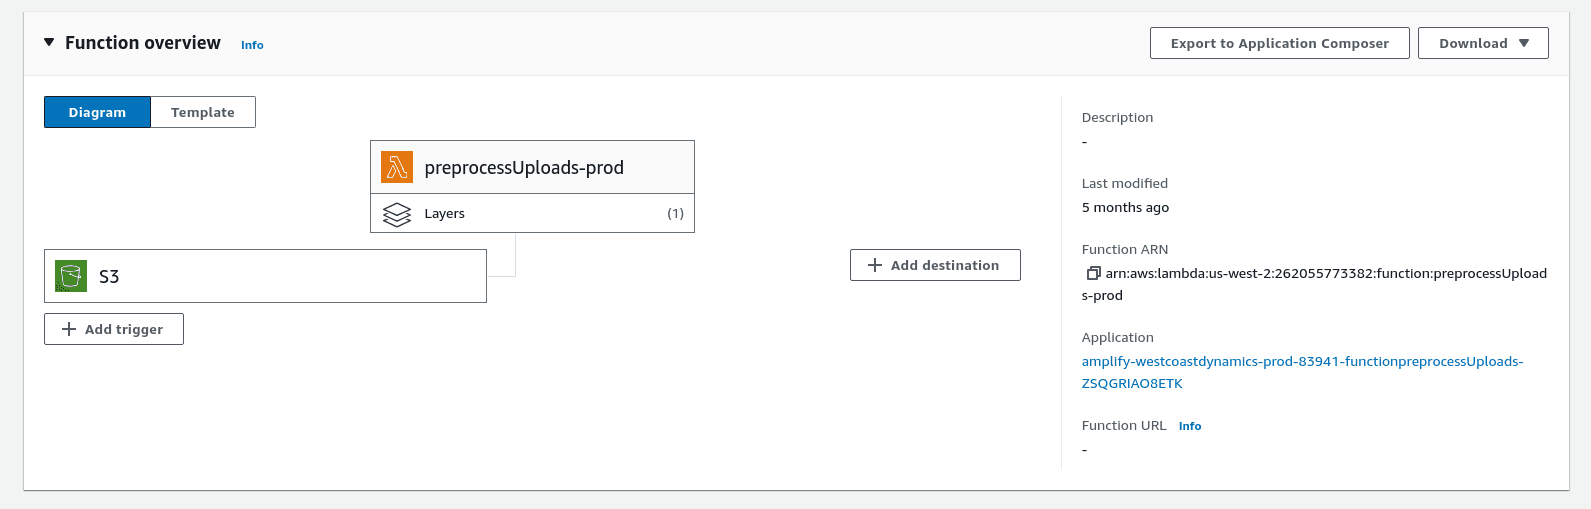
The Preprocessing pipeline is responsible for:
- Resizing images to a thumbnail, machine vision, and full size
- Generating web friendly (webp) versions of the images
- Naming the files canonically (using GPS, timestamp, and image size)
- Storing the images in S3
- Adding a reference to the images in a DynamoDB table (via GraphQL in AppSync)
- Moving the machine vision sized images to a separate S3 bucket for machine vision processing
Machine Vision Pipeline
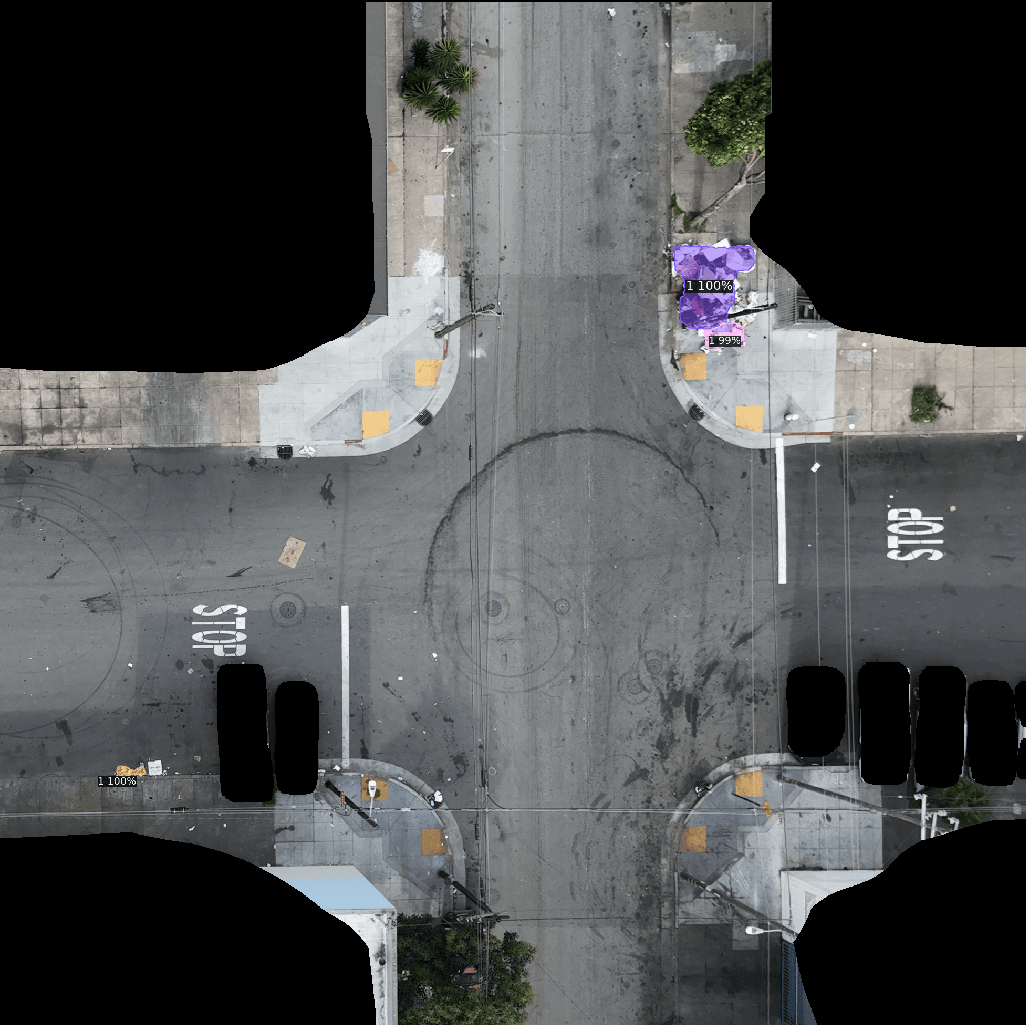
Machine Vision and Object Detection are what makes it possible to scale a small team's ability to report waste for an entire city. The machine vision model is trained to detect waste in images, and to output a JSON file with bounding boxes, confidence scores, and labels for each detected waste pile.
Additionally, the machine vision pipeline is responsible for removing private or irrelevant image data from the images. It uses a combination of (reverse) road segmentation and masking, vehicle segmentation and masking, and some clever cropping to remove irrelevant data from the images. This is necessary to protect the privacy of the people, but also helps the machine vision model focus on the streets and sidewalks where the Public Works department is operating.
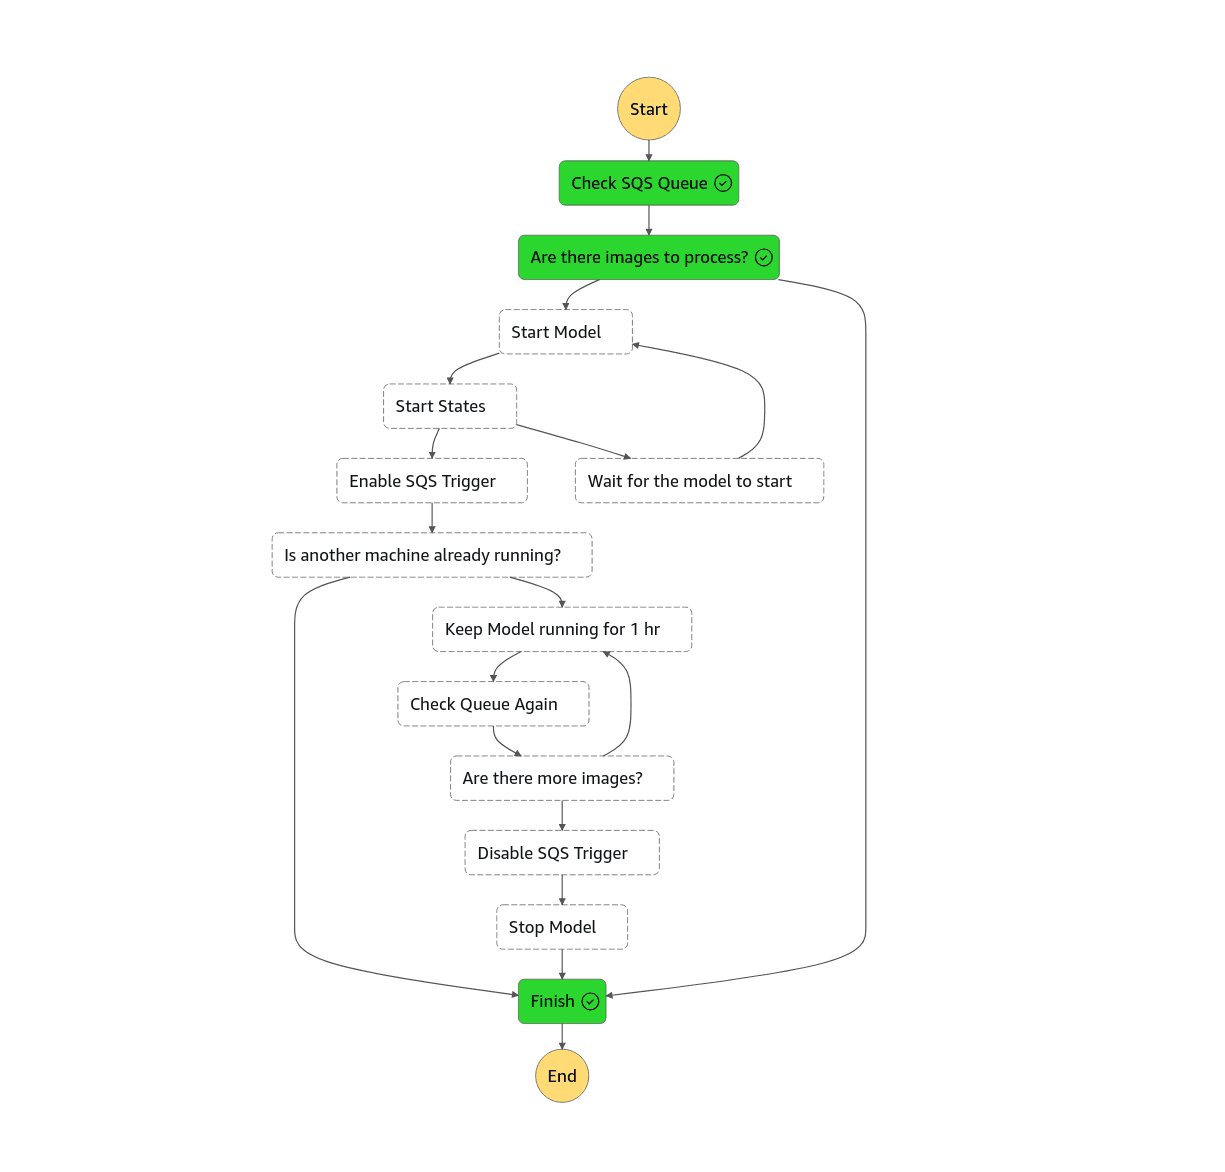
The Machine Vision pipeline is responsible for:
- Checking whether images are waiting to be processed by the model
- Starting the Waste Detection machine vision model in AWS Rekognition
- Keeping the model running for an hour (minimum)
- Stopping the model when there are no more images to process
- Outputting an image file, and a JSON file with the results of the machine vision model into an S3 bucket
Postprocessing Pipeline
The Postprocessing pipeline is designed to take the results of the machine vision model, and turn them into a set of data that can be used to report waste to the city. This results in data viewable on a map, and in a list/grid showing the location and an image of each waste pile.
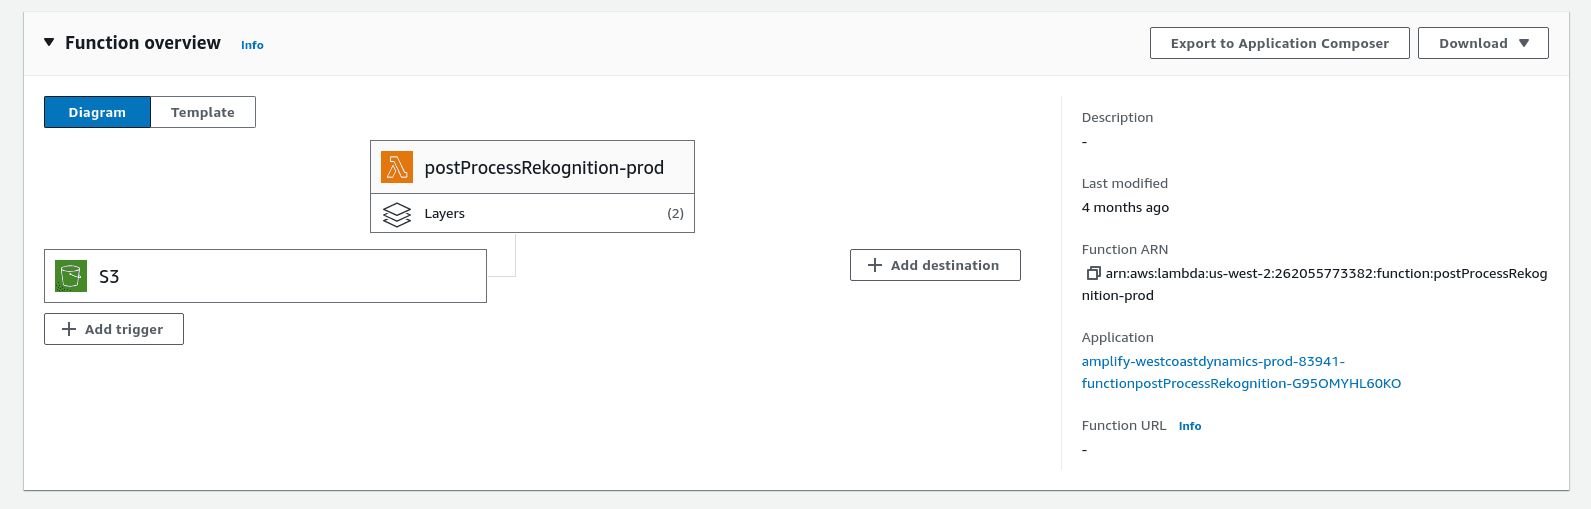
The Postprocessing pipeline is responsible for:
- Checking whether there are new machine vision results
- Calculating the precise location of each detected waste pile from metadata in the images (More on that later)
- Creating cropped images of the waste piles, and storing them in S3
- Adding the machine vision results to the DynamoDB table (via GraphQL in AppSync)
Post Processing RTK GPS and Bounding Box Data
At this stage, the system has produced a bounding box for each waste pile within the uploaded images. The bounding box is a set of four coordinates that define the corners of a box around a waste pile. The coordinates are in pixels or percentages of the image size, and relative to the top right corner of the image.
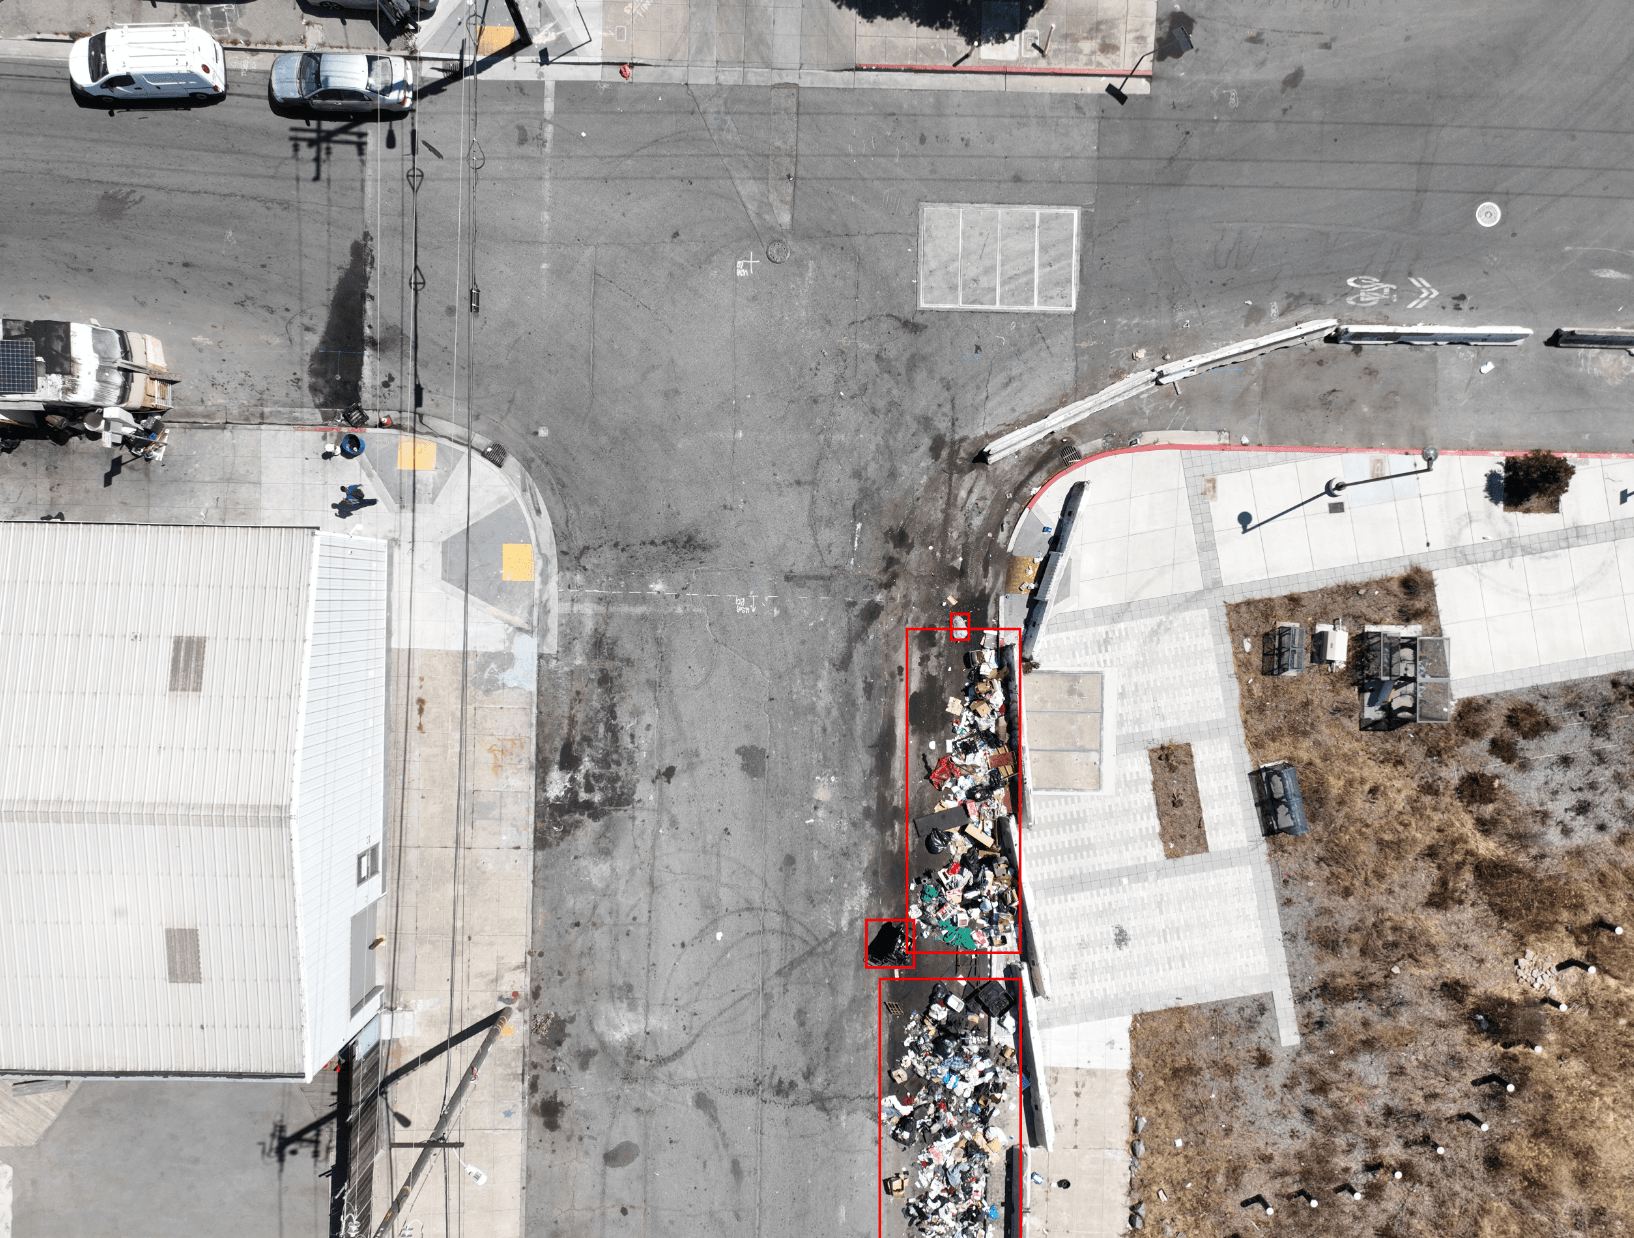
The bounding box needs to be placed in the global coordinate system of latitude and longitude. This is necessary to report the waste pile to the city, and precision is important. A report that is off by a few feet can result in the waste pile not being cleaned, due to the city not being able to find it. You would be surprised how hard it can be to find a pile of trash with cars parked around it, trees, signs, boxes, and other objects in the way.
Geolocation into World Coordinates
The geolocation of the waste piles is done by using static features of the drone camera, like focal length and sensor size, as well as the GPS coordinates of the drone, and the altitude, yaw, pitch, roll of the drone when the image was taken. The drone is equipped with a high precision Real Time Kinematic (RTK) GPS, as well as high precision Inertial Motion Sensor (IMU). The RTK GPS and the IMU combined are accurate to within a centimeter.
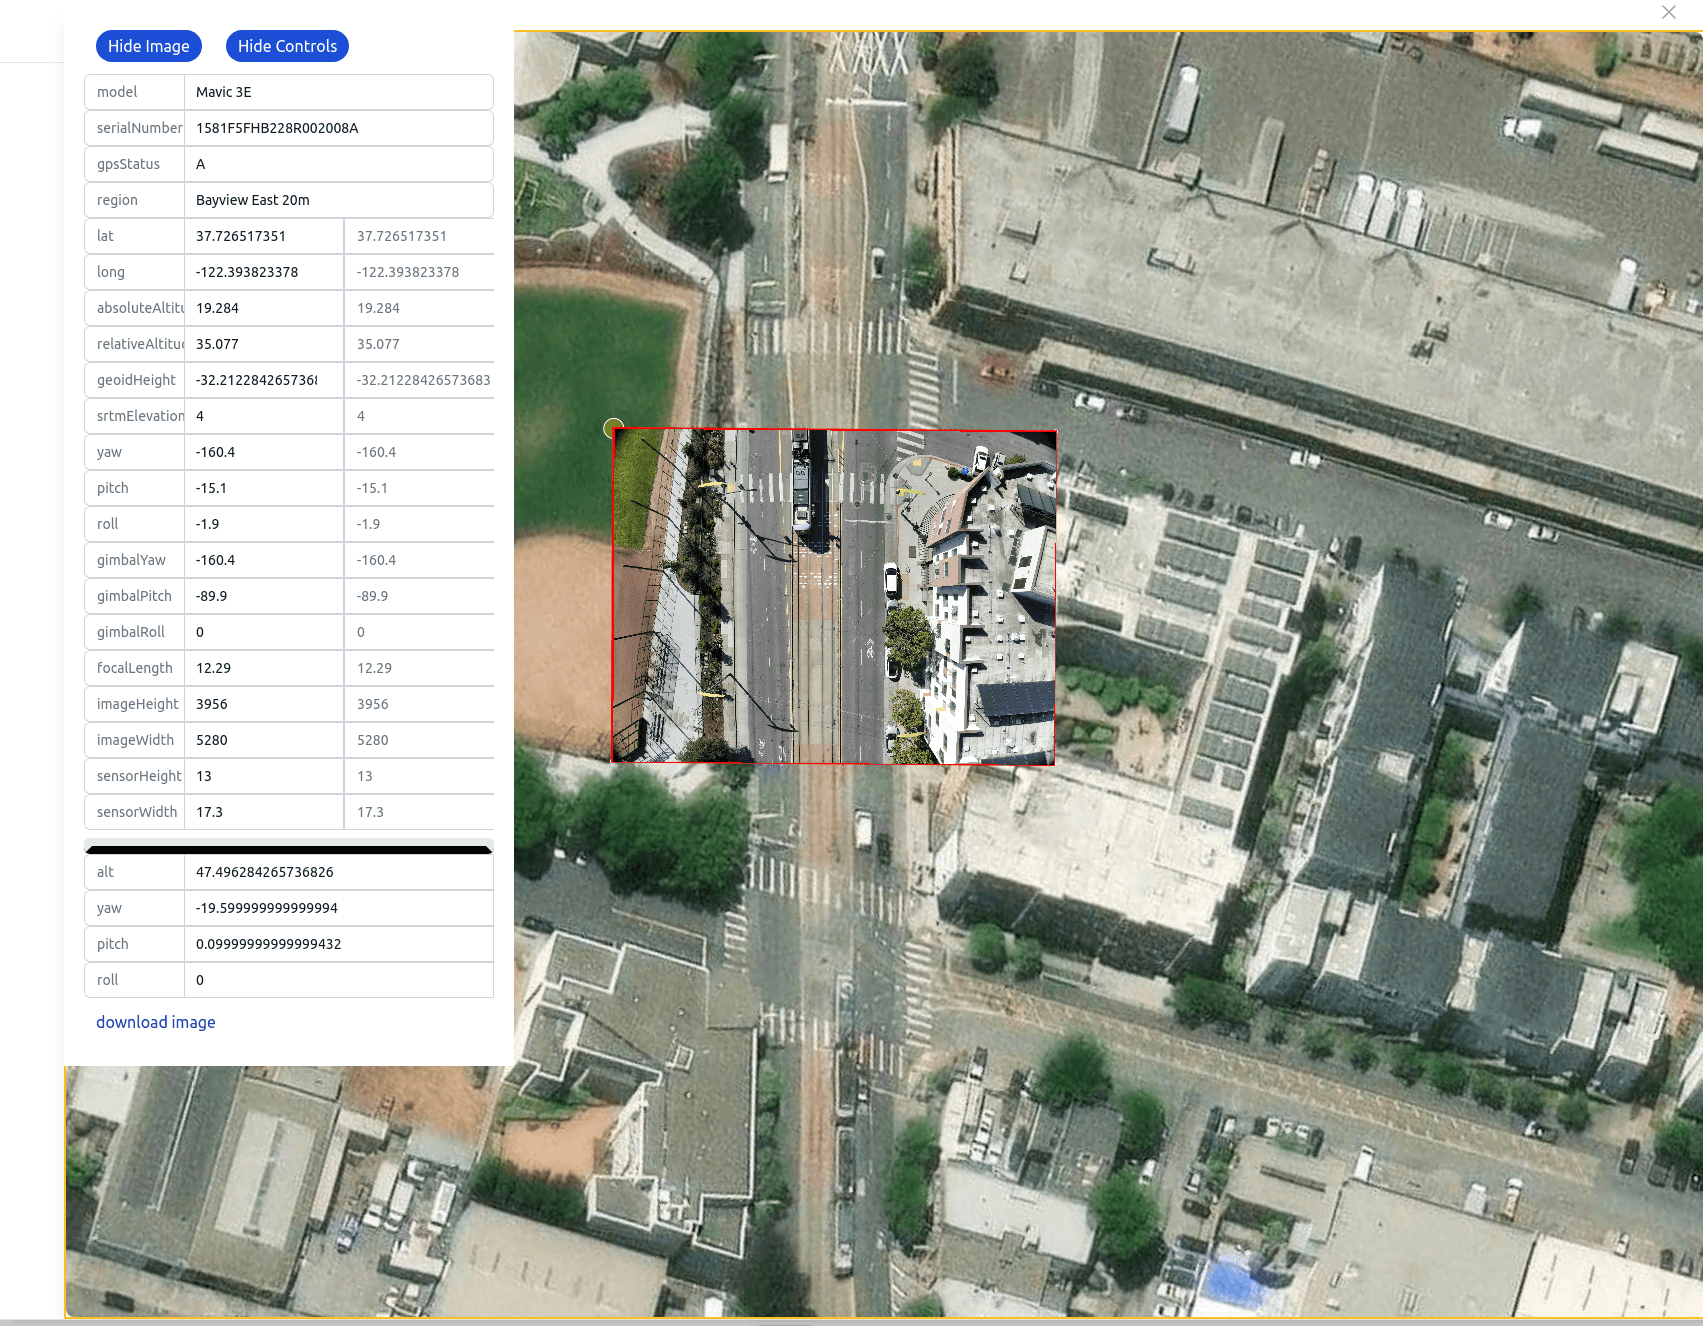
In order to determine the location of a waste pile within the photo, the following steps are taken:
- Extract the lat/long, ellipsoid altitude, roll, pitch, yaw of the drone camera sensor when the image was taken.
- Ensure the altitude is calibrated correctly against the ground elevation at the location of the drone, using Satellite Radar Topography Mission (SRTM) data, and the center of the drone image lat/long.
- Using the focal length, sensor size, and precise location data above, project each corner of the bounding box into the world coordinate system (lat/long)
- Calculate the center of the bounding box by averaging the four corners
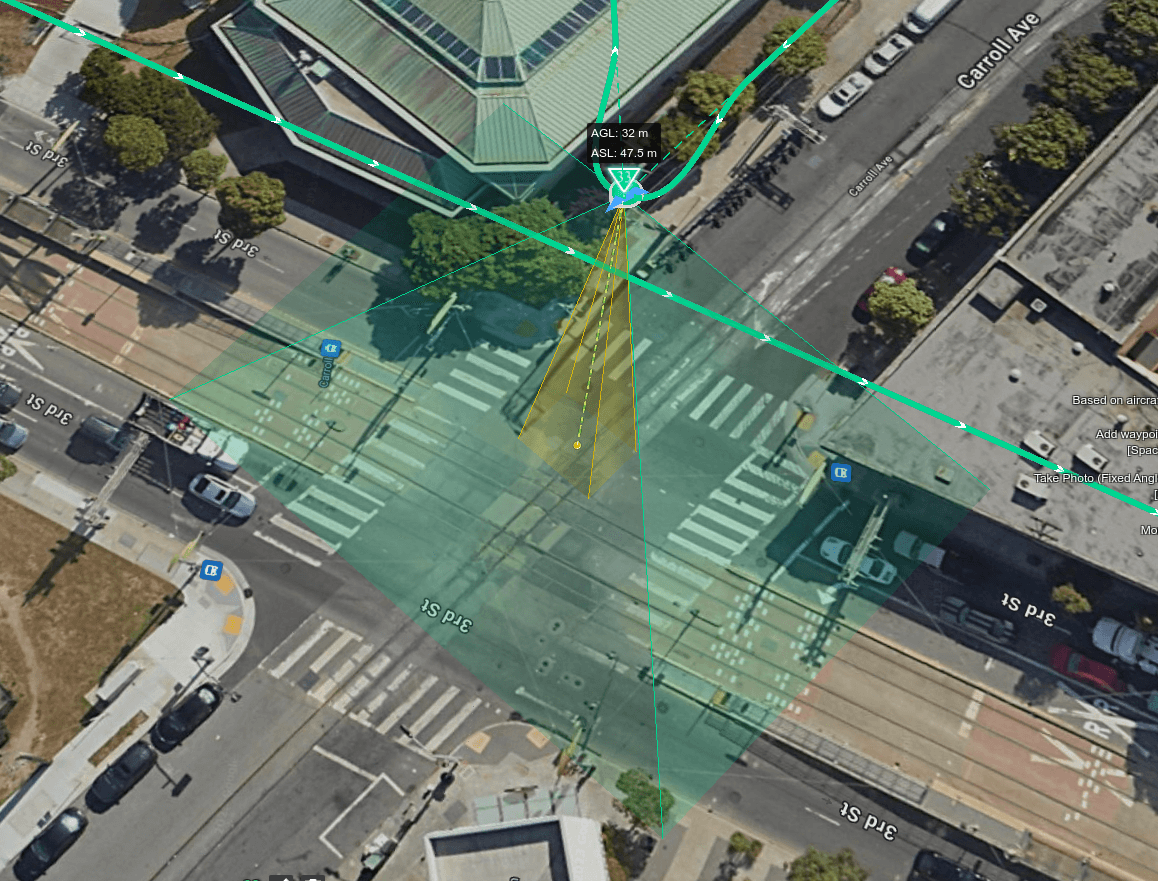
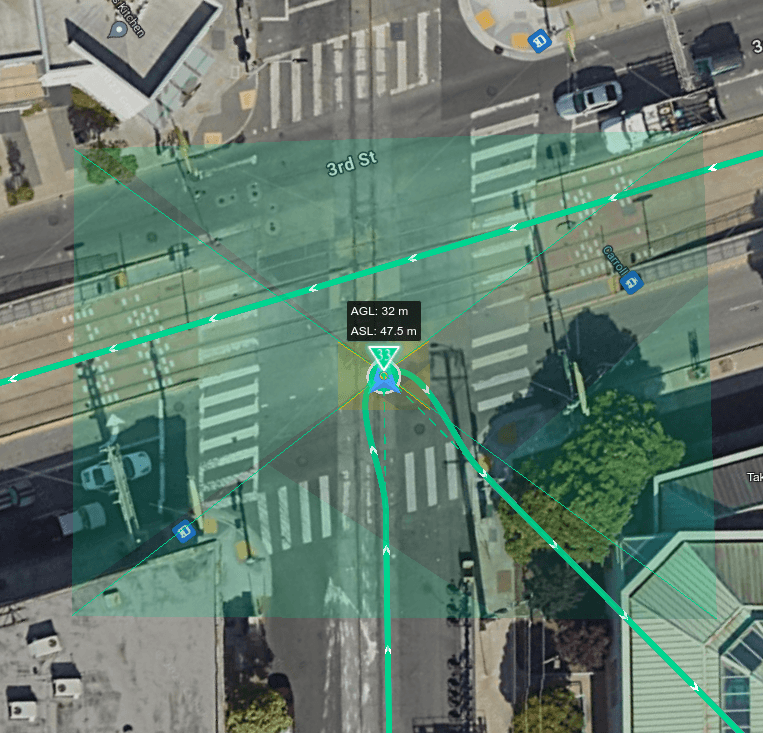
Projection into World Coordinates
We use Matrix math to rotate vectors for each corner around the axis of the drone's camera. We then create a projection onto a "flat" surface at a distance equal to the relative altitude. This yields a set of coordinates that are in the global coordinate system of lat/long.
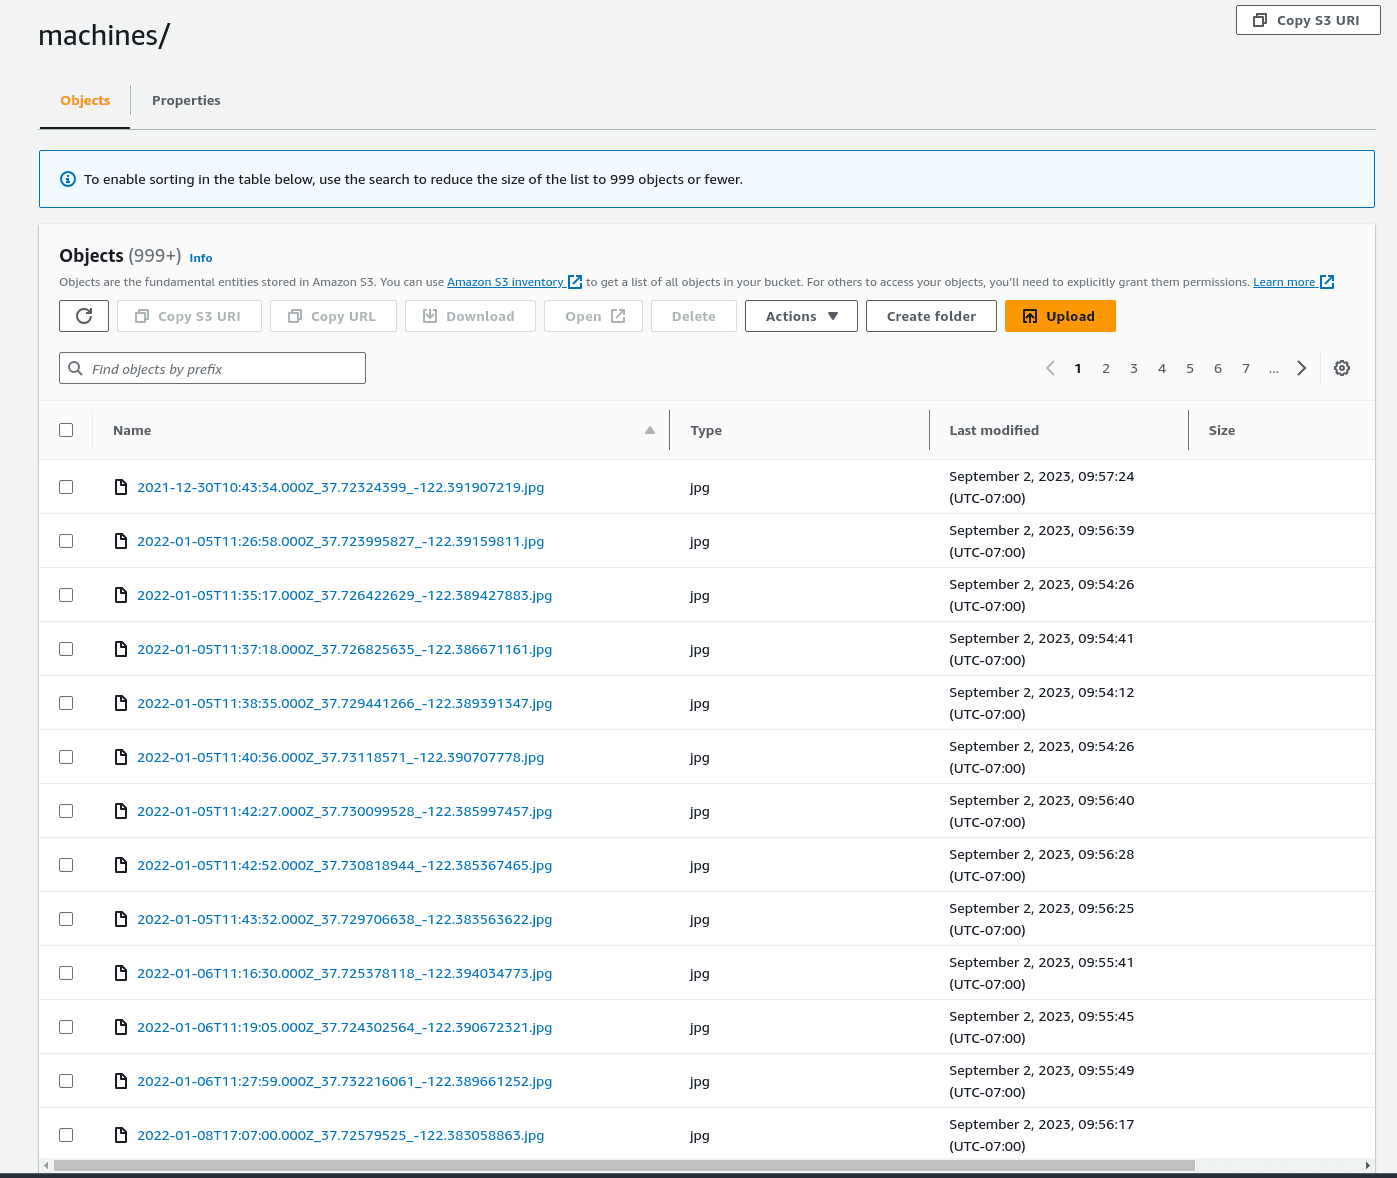
Data Storage
Aerbits uses AWS S3 and DynamoDB to store millions of images of streets, sidewalks, and piles of waste. The images are stored in AWS S3, and made available through Cloudfront. A reference to each image along with the metadata is stored in DynamoDB. The machine vision bounding boxes, and location data are also stored in DynamoDB. All of these DynamoDB tables are exposed via AppSync GraphQL APIs, and made searchable when necessary using ElasticSearch.
Data Visualization
Aerbits uses a combination of map and list/grid views to visualize the data. Aerbits uses NextJS and TailwindCSS as well as the AWS Amplify framework to build the web application. This includes a full stack Server Side Rendered Web Application, with a GraphQL API, and a CI/CD pipeline. The web application is hosted on AWS Amplify, and the CI/CD uses Github Actions to trigger and build each stage of the pipeline.
Amplify allows for a single entry point for managing a full stack web application. It includes a GraphQL API, a set of lambda functions, file storage (via S3), authentication via Cognito/IAM/OAuth, Analytics via Pinpoint, and a CI/CD pipeline. Amplify also includes a set of React components that make it easy to integrate the various services into a web application.
Map Views
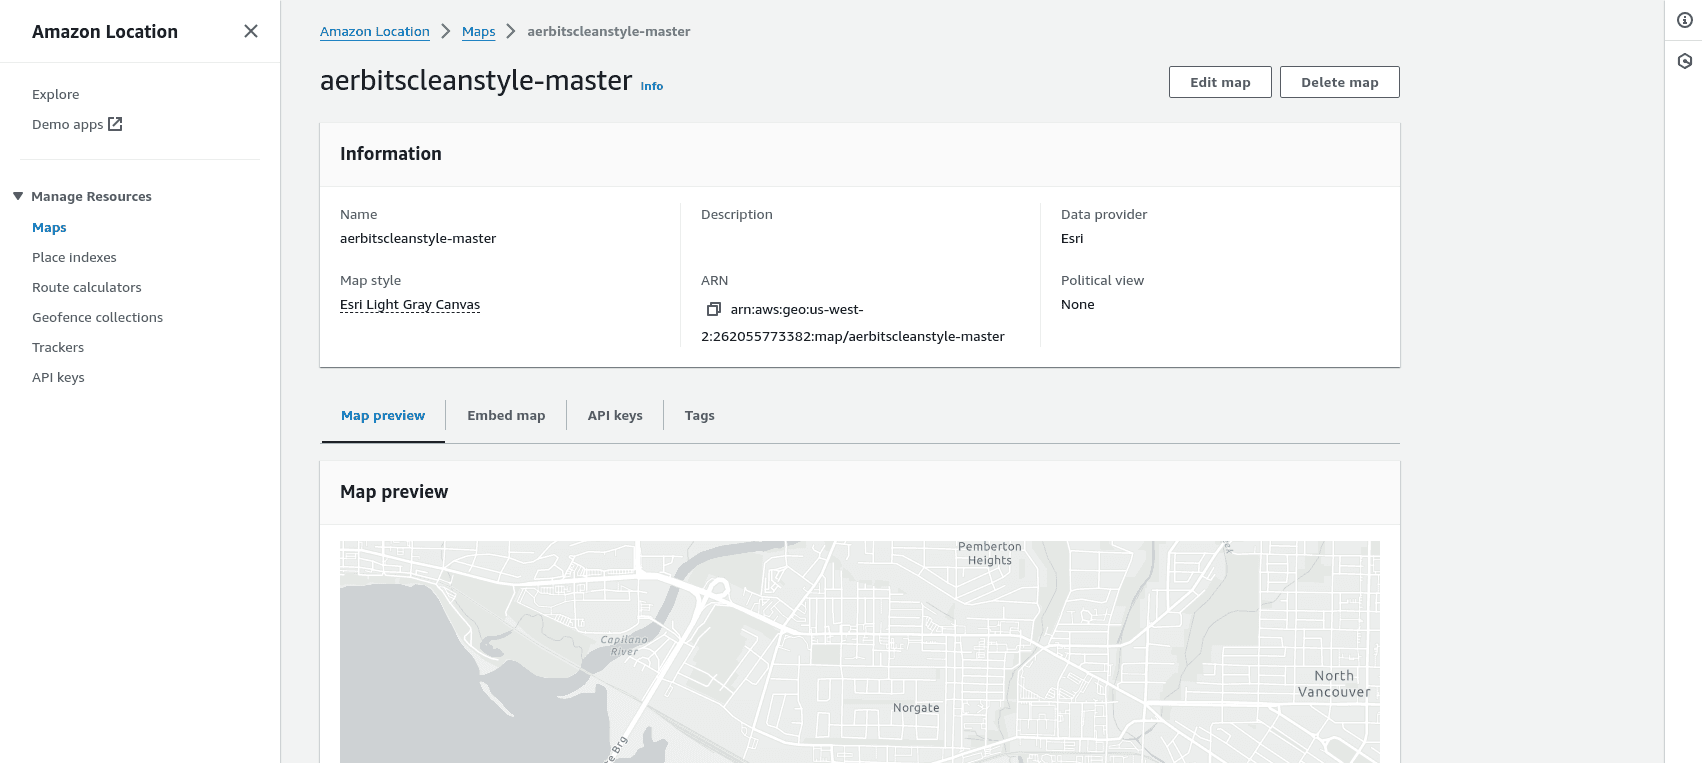
The map view is powered by AWS Geo/Location services, and uses @aws-amplify React components to provide the basic waste pile mapping functionality. The list/grid view is powered by a GraphQL query to AppSync, and the images are loaded from S3 via Cloudfront.
AWS Location Services
AWS Location Services offers a robust set of APIs and UI Components for building maps into web applications. These tools enable quick progress, and also allow for customization of the map and the data that is displayed on the map.
Clustered Markers
Using the latitude longitude and a k-means clustering algorithm, the location of the waste piles can be clustered in both map view and the grid view.
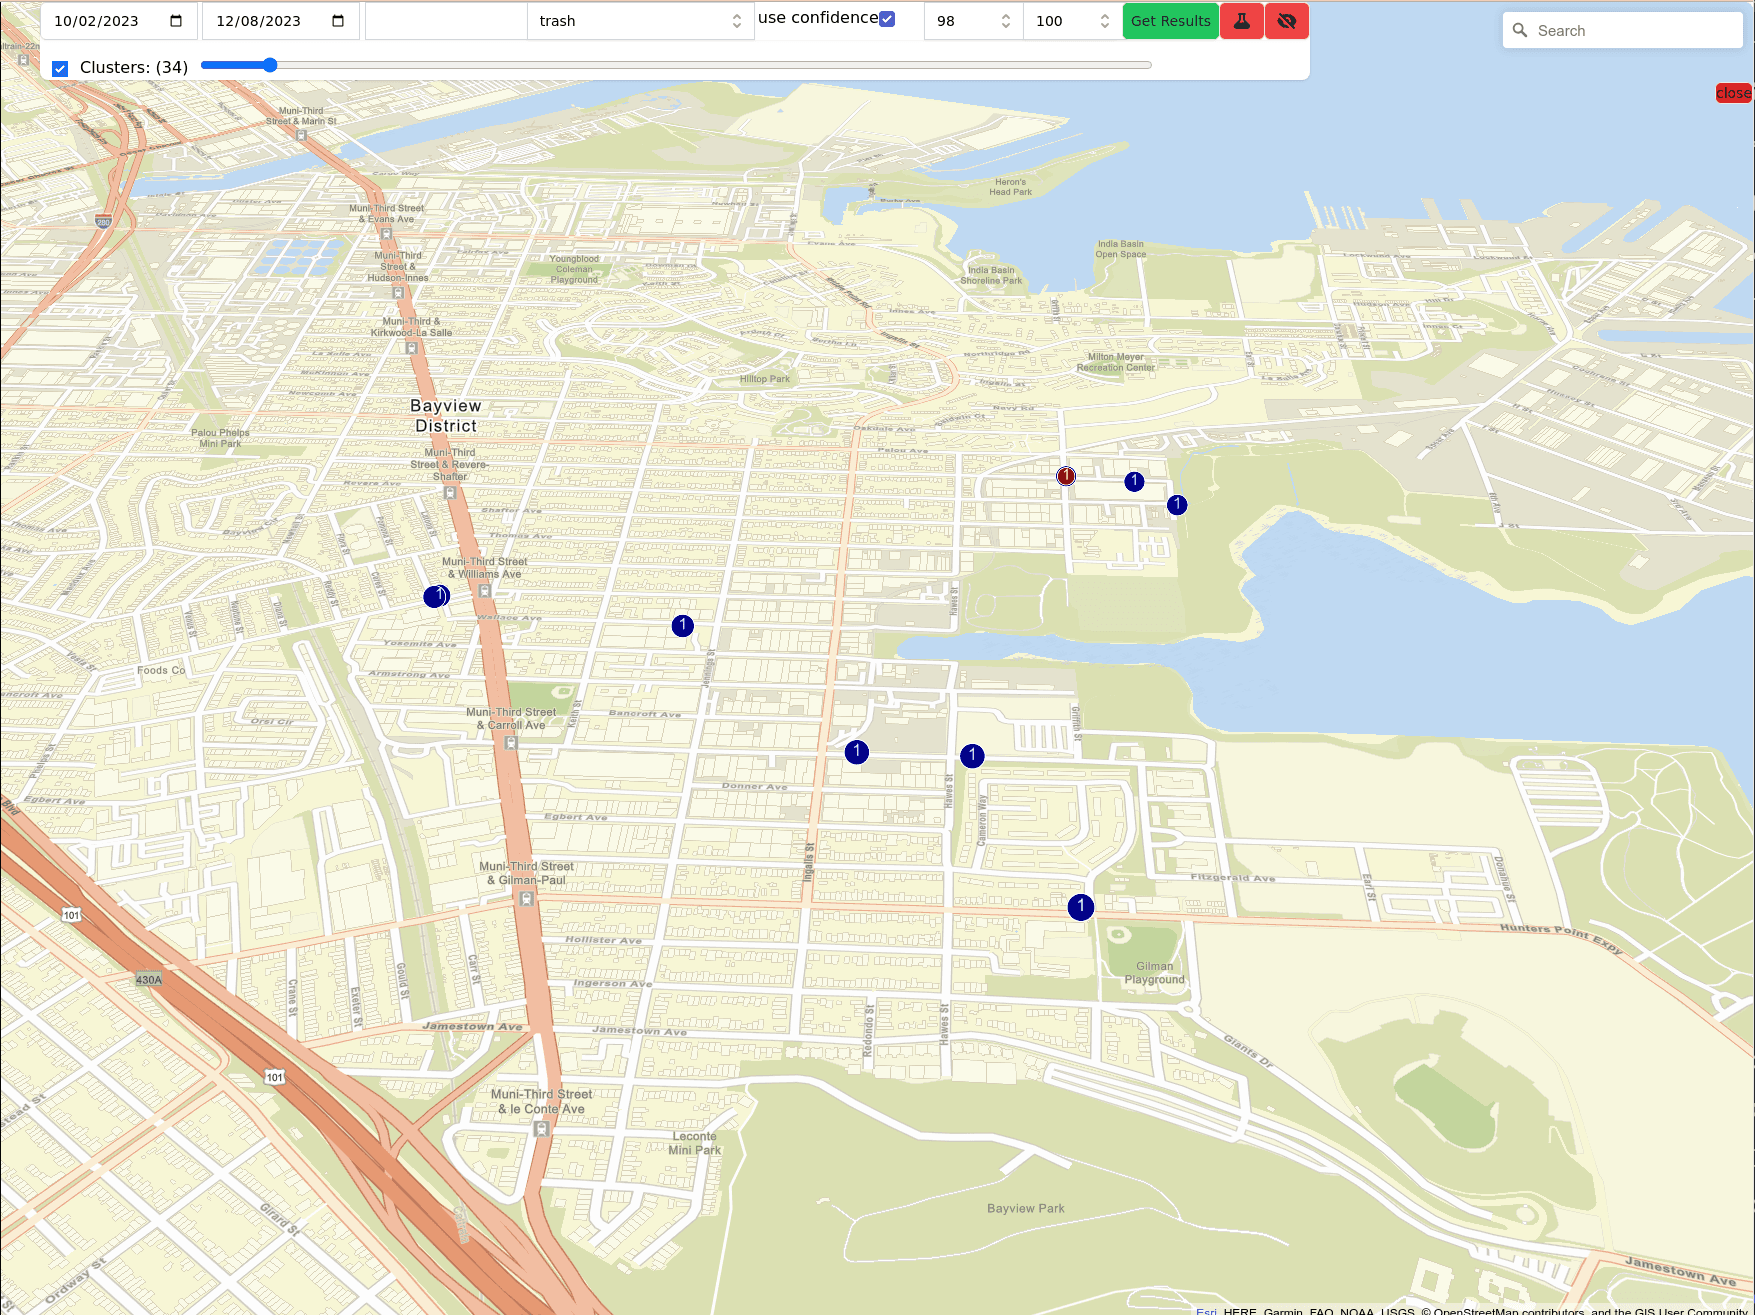
Clustering the markers is useful when determining the location of the waste piles. Often piles of waste will be grouped closely together, and it is useful to quickly see natural groups. When reporting these groups to the city, it is beneficial to give the city information about surrounding piles and provide some context for the waste pile and other nearby waste piles.
Grid Views
Aerbits offers a grid based view for seeing just the waste piles in a grid. This view is useful for quickly scanning the images of the waste pile and determining whether they are actually waste piles we want to report to the city.
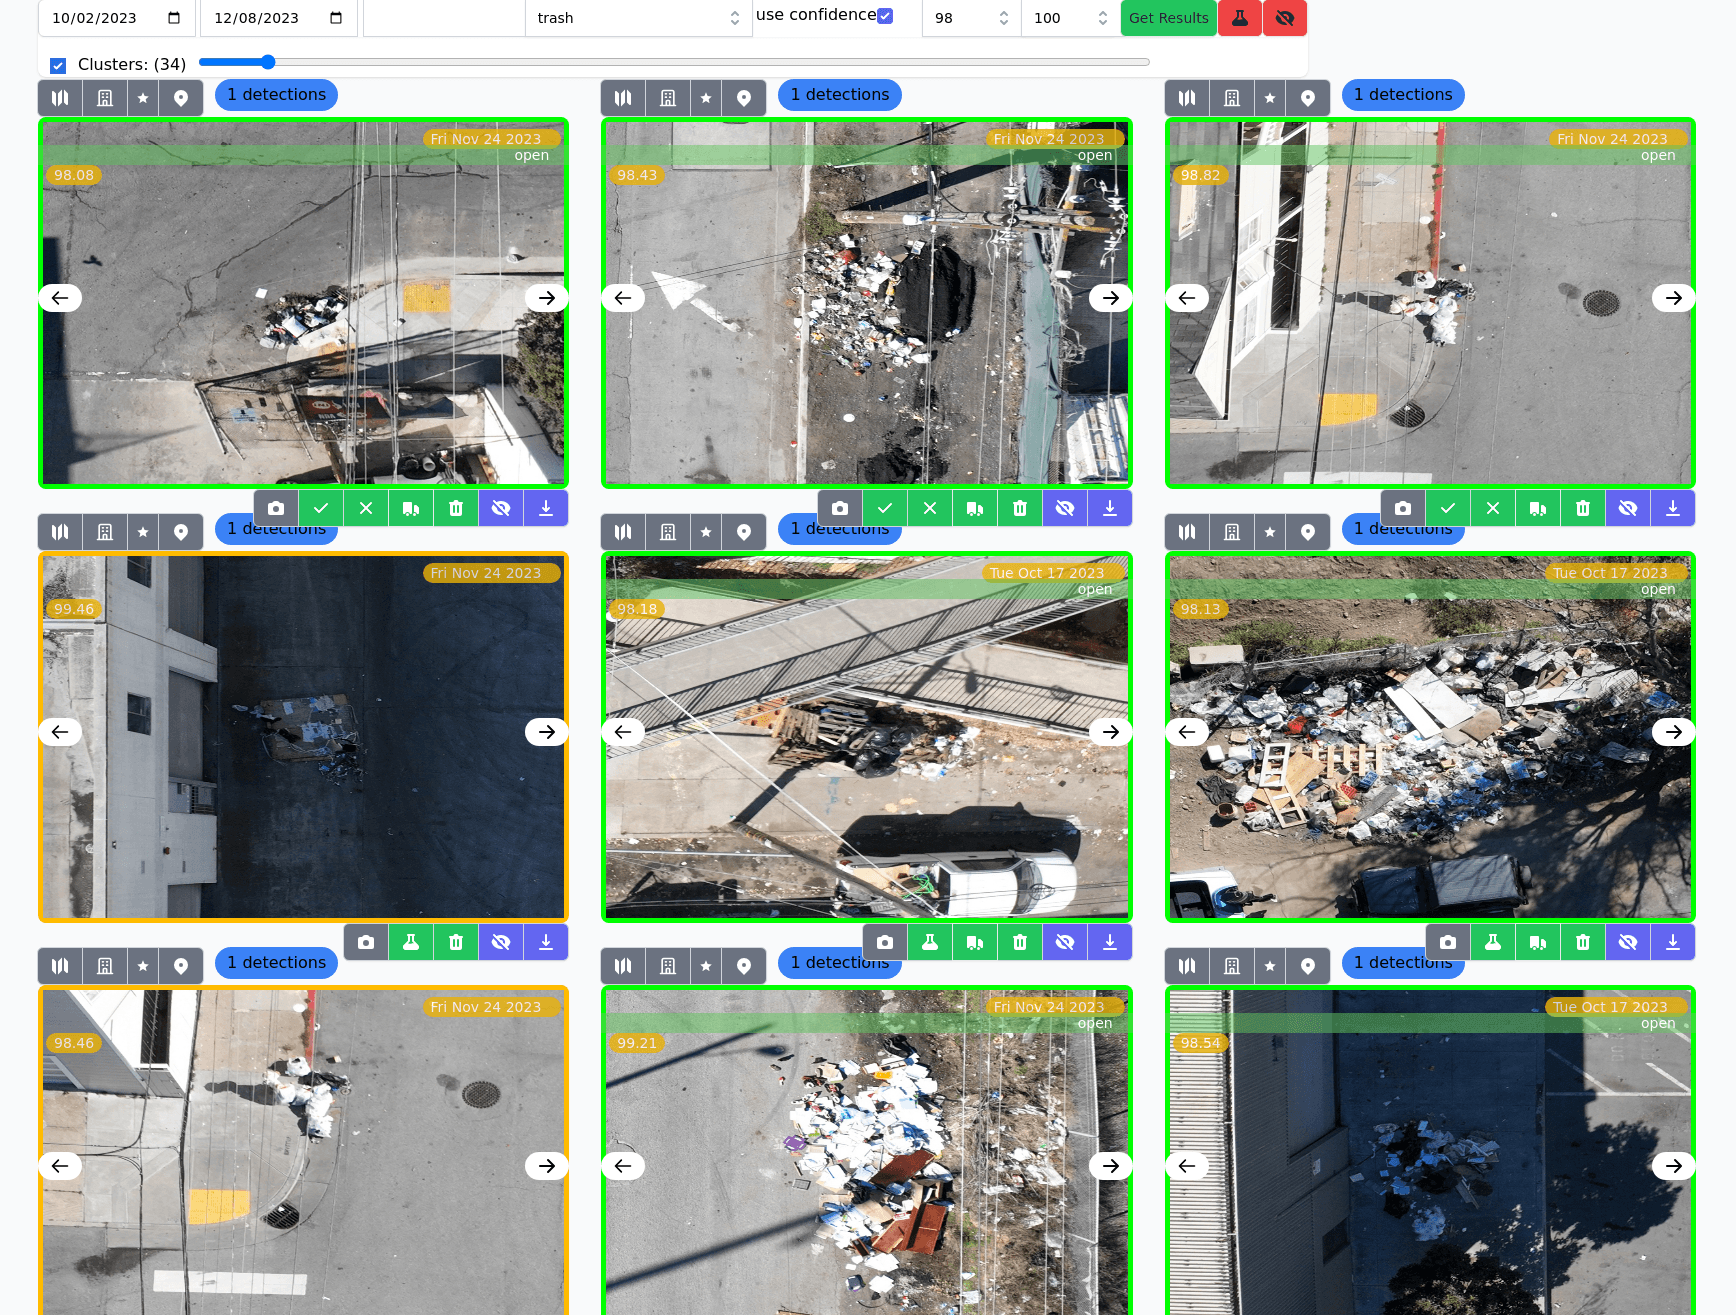
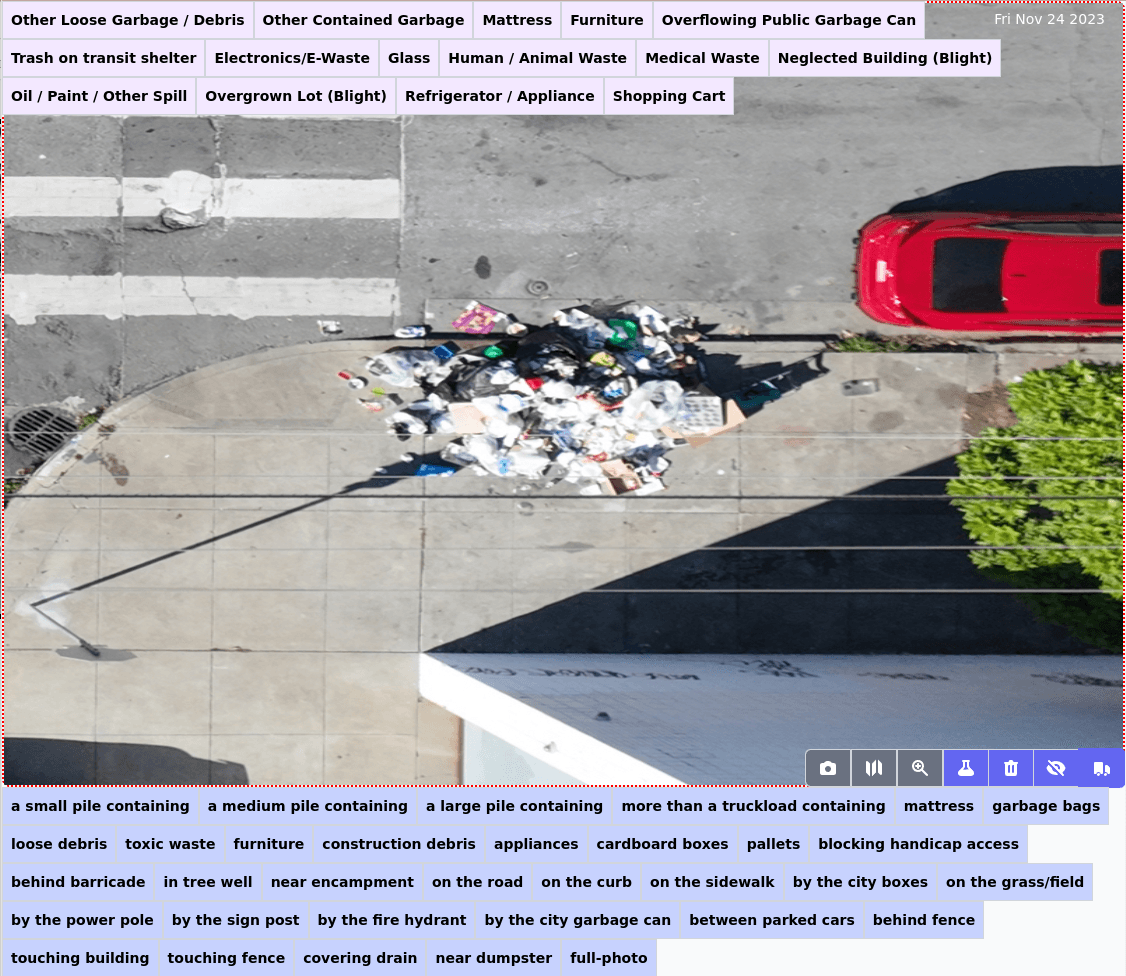
Additional Functionality
Aerbits also offers several convenience tools, tied into the grid view. These functions are accessible through icon buttons that trigger a function when clicked.
- View images on a map
- View location of waste on Google Maps / Street View
- View all waste piles within a specified radius
- Add waste pile annotations to Object Detection dataset
- Report waste pile to the city through SF 311
- Mark the waste as trash
- Mark the waste as not trash
- Download the cropped image
- View the original drone image (used for getting context)
- Show the nearest street address for the waste pile
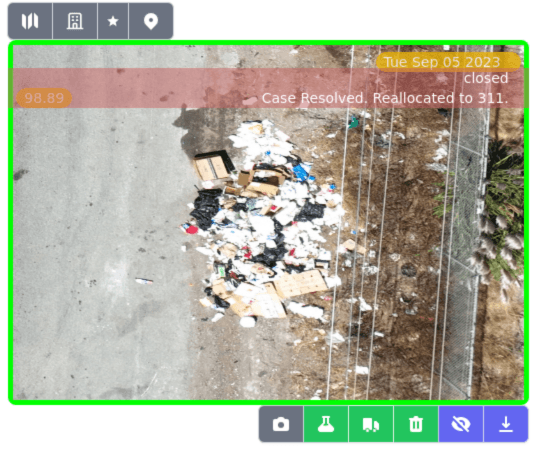
Reporting Waste to the City
Aerbits offers a streamlined way to quickly report detected waste to the city. This approach uses a manual process to ensure that the city is only receiving reports of actual waste piles. A human operator is required to review each detected pile to determine how it should be filed, and whether it should be reported to the city. This user interface provides a way for an operator to quickly review the waste piles, and with a few clicks file an informative, accurate, and precisely located report with an aerial image to the city.
Aerbits is integrated with the San Francisco 311 API directly, and has the ability to programmatically file reports with the city. It's a two-way integration, giving Aerbits the ability to get statuses, notes, and final dispositions for submitted reports.
External Dependencies
Aerbits depends on a few external dependencies. We don't produce drone software or flight planning software (yet), as the existing software is good enough for our purposes. We do however integrate with the existing software to collect information about flight paths, and to upload images and flight logs to the cloud.
SF 311 API
Aerbits integrates with the San Francisco 311 API to file reports with the city. The 311 API is a REST API, based on the Open311 standard. The API is well documented, and easy to use. SF 311 monitors reports through the API and files them with the appropriate department.
311 API Integration (Lambda Functions)
Aerbits uses a Lambda function, listening to the DynamoDB table for new reports, and then another Lambda function that periodically polls the 311 API for the status of each open report. This allows Aerbits to keep track of the status from the city side and determine whether it needs to file a second report for the same waste pile.
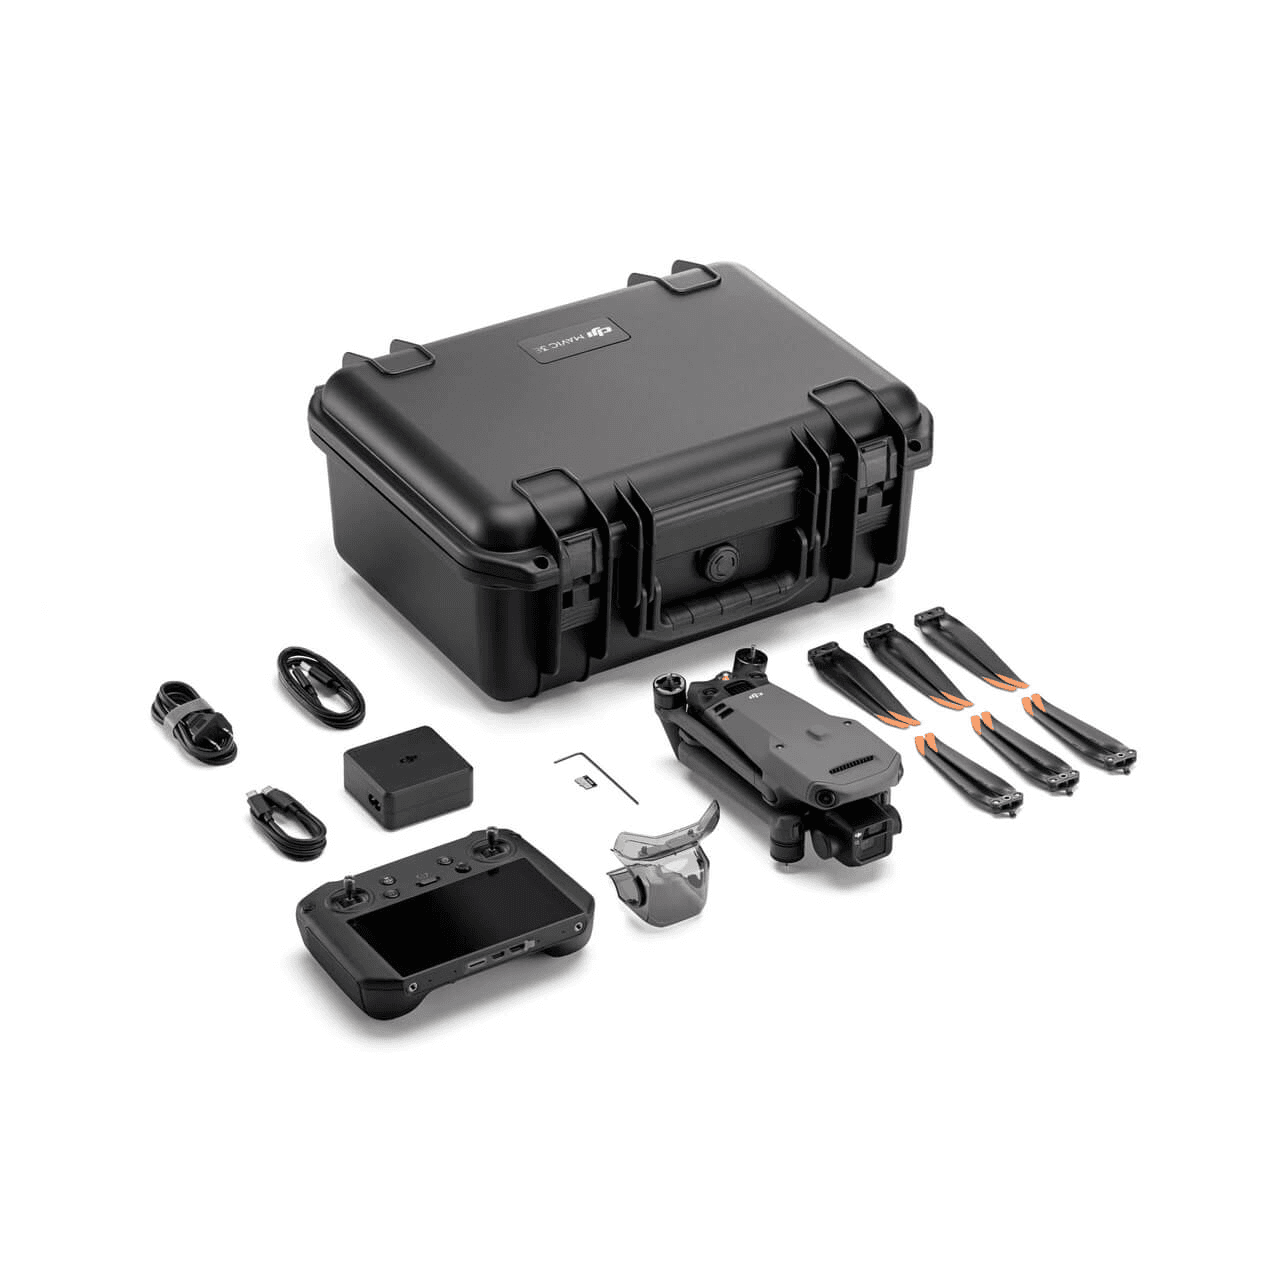
Drones and Flight Planning Software:
- Drones
- DJI Mavic 3 Enterprise
- AgEagle eBee X
- Drone flight planning software
- DJI Flight Hub 2
- Sensefly eMotion 3
Drones and GPS
The data collection function is a combination of a drone and a data ingestion pipeline. Aerbits relies on drones equipped with high-resolution cameras and high precision GPS to collect data. The drone is capable of being reprogrammed to fly a specific route and take pictures at specific intervals and specific altitudes.
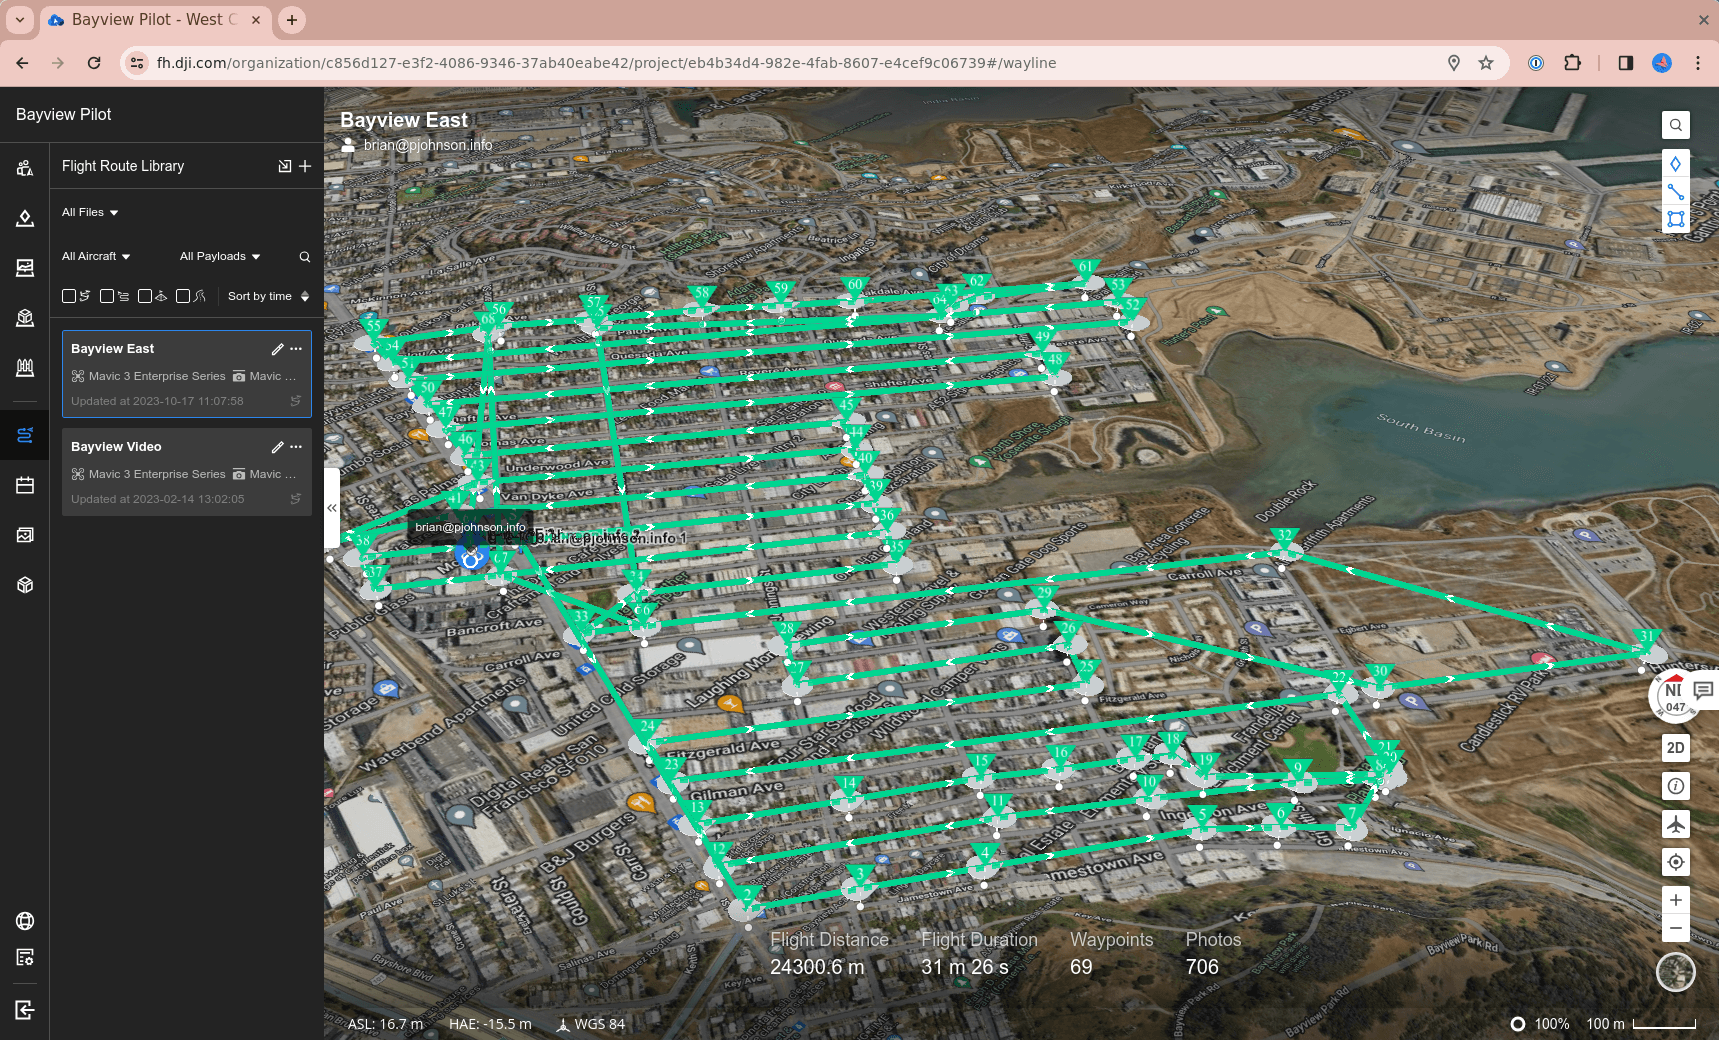
Flight Planning
The drone manufacturers like DJI and AgEagle provide software for planning flight routes. This software provides a user interface, where a flight path can be plotted, and several parameters, such as height, speed, and photo interval can be set. The software then generates a flight plan that is synced to the drone, and the drone can autonomously fly the route, taking photos, and returning home when the battery is low or the route is done.